
J.H.K.C. Psych. (1991) 1, 6-11
SPECIAL TOPIC: BRAINING MAPPING
Summary
Computerised analysis of EEG and Evoked potential (EP) data yields more useful information than unaided visual inspection. Comparison between measures from patients and a database derived from normal controls increase the sensitivity and accuracy in detecting abnormalities. In contrast to conventional tracings, brain maps of raw EEG/ EP data or the relevant statistics are simple and clear to read. Preliminary findings in the topographic brain mapping of EEG and EP from a pilot single case study on Chinese subjects can differentiate between normals and patients with neuropsychiatric and other psychiatric disorders. The potential use of brain mapping in the subtyping of psychiatric disorders in the Chinese requires further studies.
INTRODUCTION
In the 1930s, the discovery of a scalp-recorded electrical rhythm responsive to eye closure (alpha rhythm) by Hans Berger and the demonstration of electrographic concomitants of epilepsy (spike and wave) by Gibbs led to the belief that EEG would prove to be a major clinical and scientific tool in the description of normal and pathological brain function. In the field of evoked potentials, workers were enthusiastic in the investigation of short and medium latency potentials (Somatosensory, auditory, visual) and long latency cognitive potentials (P300, Contingent negative variation, postimperative negative variation, readiness potential) by measuring amplitude and latency and amplitude recovery and latency recovery after a double stimulus. Although EEG had proved its role in the study of epilepsy and other neurological and neuropsychiatric conditions (Hughes & Wilson, 1983), most normal and many abnormal brain states failed to produce an EEG signature as characteristic as the epileptic discharge. As for evoked potentials, while short latency potentials bear distinct anatomical relationship to brain stem and pathway structures, there is no such relationship with the long latency potentials and there is high variability in the latter in their amplitude, latency and spatial spread. (Shagass, 1983)
In a review of the clinical application of EEG, Duffy (1989) believed that the problem discussed above was not an inherent lack of EEG sensitivity but rather the reliance upon unaided visual inspection. He postulated that there was more useful information in the. EEG than could be detected and quantified by visual inspection. He summarized the process by which an electroencephalographer went about reading an EEG:
- Search for discontinuities
- Spectral analyses of frequency content
- Temporal summation over time
- Spatial topographic analyses
- Statistical analyses
Duffy regards visual screening of data of discontinuities such as spikes, sharp waves and artefact as the traditional first step. This has been so reliable and valid that even computerized spike detection algorithms rely upon visual inspection as the "gold standard".
Spectral analysis involves an estimation of frequency content (eg. delta, theta, alpha and beta), its consistency or lack of consistency over time, and its spatial extent. Success in the extraction of information from EEG background by visual inspection has been more limited and Duffy recognizes that a computerized approach appears to be of greatest potential value in this area.
The basis of the technique of spectral analysis is to break down long EEG segments into shorter segments or epochs ranging from one to ten seconds, analysed separately and subsequently averaged and summarised to represent the mean EEG spectral content over a specific time. The standard deviation (SD) of each spectral band can be derived and the coefficient of variation (the SD divided by the mean) constitutes a useful parameter of spectral variability. This parameter can be understood as a measure of paroxysmal activity within a spectral band. Similar statistical analysis can be done on the spatial dimension as well. The final step is to map these spectral and spatial data into single images.
As for long-latency cognitive evoked potentials, it appears that individual component measured by surface electrodes represents the superimposition of waves from multiple spatially dispersed neural generators rather than single discrete anatomical structures as in the case of short and medium latency evoked potentials. Therefore, not only amplitude and latency but also spatial spread, are require·d to define the contributing neural generators or components of any long-latency evoked potential. To achieve this end, one can create a series of maps over time from sets of multichannel EP data so as to define the spatiotemporal relationships more clearly.
However, a brain map of raw EEG/EP data by itself still does not overcome the intrinsic limitation of naked-eye detection of abnormalities. The important step is a comparison between the patients map to that of controls or reference data. This reduces the need to maintain an image of normality in the mind of those who read EEG or EP data. Analysis is achieved by mapping the deviation of the patients map from normal and has been referred to as Significance Probability Mapping by Duffy. The commonly used tests are the parametric statistics like the Student's t test or the z-transformation. The issue here concerns the appropriateness of these tests for neurophysiological data as these are not normally distributed. There is, in addition, a more fundamental issue of differentiating chance and real findings. Researchers have come up with several solutions to these problems using various mathematical transformation (John, 1977).
The advantages of EEG and EP brain mapping have been summarised by ltil (1990) as: 1) quantified and color coded--more objective and simpler; 2) quantitative comparison with age-matched normal becomes possible; 3) longitudinal and quantitative comparison allows objective monitoring of the progress of an illness and effect of drug treatment on patients over time; 4) quantitative deviation in every frequency band can be detected and sensitivity of detection of abnormality increases; 5) establishment of diagnostic group database assists in diagnosis; 6) allows quantitative measurement of psychotropic drugs at CNS level; the most CNS effective drug for each individual patient may be predicted and selected; and 7) monitor of overdose and underdose of psychotropic drug treatment. In essence, it is the quantification and analysis which leads to an increase in sensitivity and accuracy in the detection of abnormality. The main areas of application will be monitoring of a disease progress, the predicting and selecting of medication and the monitoring of the subsequent response, and finally, the establishment of valid diagnostic groups. This last point is echoed by Blackwood and Muir (1990) who suggest that P300 has the potential to distinguish subtypes of dementia, schizophrenia and depression.
The aim of this study was to obtain normative data from Chinese subjects and to collect electrophysiological measures from Chinese patients with various psychiatric illnesses. The study was perceived as an early pilot study. The results obtained would be used to formulate a hypothesis for further brain mapping research in Chinese in the future.
METHOD
All studies were performed in an electrically shielded room. The EEG was recorded from 16 electrodes using the 10-20 system. Electrodes were applied in a cap and filled with conductive jelly. The impedance of electrode skin contact was maintained below 5kohm. For EEG recording common average reference was used while for EP recording the bilateral mastoid reference was that used by Maurer et et al (1989), this was a linked mastoid placement with a l0kohm resistance in each link. The electrical activity was filtered with bandpass filters of 0.7-50Hz for both EEG and EP. Patient data were transferred from the scalp electrodes directly to Dantec Concerto Brain Mapping System sampled at a rate of 128Hz per channel.
THE NORMAL GROUP
Ten medical students were studied, all had normal hearing and a good health record with no history of substance abuse. Each subject has had an 'eyes open' and 'eyes closed' EEG brain mapped. Thirty seconds of artefact free EEG in each condition has been collected. The paradigm for the P300 was a binaural tone of lOmsec rise time, 50 msec plateau and lOmsec fall time, given at a repetition rate of 1.1 second. The frequent tone was at lkhz while the rare tone (with a probability of occurence of 20%) was at 2khz.
The response to sixty rare tones was averaged, the subject was instructed to count the rare tones and one P300 EP was collected. The Dantec mapper has an artefact rejection system, but the EEGs were also monitored for artefacts.
THE STUDY GROUP
One patient with the diagnosis of Huntington's disease, one with complex partial seizure, one catatonic schizophrenic and one paranoid schizophrenic were studied in a similar manner.
.png)


RESULTS
FINDINGS IN NORMALS
The EEG maps of Chinese normals are shown (Fig. 1 & 2). Fig. 1 displays a conventional 16 channels common average reference EEG tracings with 2 maps alongside showing the topographic distribution of electrical potentials in root-mean square (RMS) voltage values (top right) and in instant voltage values (bottom right) respectively. The RMS value is a computed average value of voltages recorded at each individual electrode over a specified length of epoch, say 10 seconds. Because of the nature of the mathematical computation involved, RMS value is always positive. On the other hand, the instant voltage value is the measure of the electrical potential at a particular point in time and it has either a positive or negative value. By convention, a negative voltage is represented by an upward movement of the recording pen. Brain mapping utilises the rainbow colour spectrum to code the voltage values. The positive values are coded with colours towards the red end of the spectrum, the negative values towards the purple end of the spectrum.
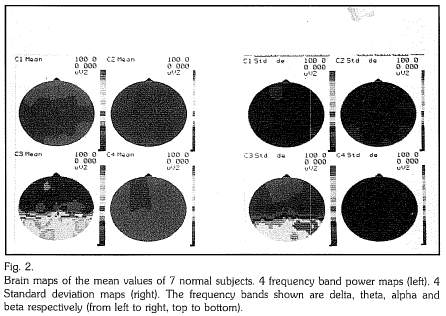
Fig. 2 shows another way of mapping EEG recordings. The topographic distribution of mean RMS values of each of the delta, theta, alpha and beta frequency bands recorded from our normal sample are shown on the left on Cl, C2, C3 and C4 respectively. Only the data from seven of the ten normal subjects were used. The data from the other three subjects were rejected for unacceptable artefacts. The posterior predominance of alpha rhythm is well demonstrated. The standard deviations of the RMS values, their topographic distribution in the sample for each frequency band is mapped and colour coded correspondingly on the right side.
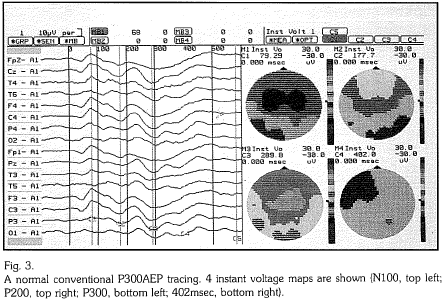
A normal conventional recording of a P300 Auditory Evoked Potential (AEP) is shown on the left in Fig. 3. The NIOO, P200 and P300 are seen as occurring at around 79.29msec., 177.7msec. and 289.Smsec. respectively. On the right the topographic distribution of instant voltage values at the time of occurence of NIOO, P200 and P300 electrical potentials as well as that at 402msec are shown. The P300 peak at 289.9msec. is displayed clearly and is centered around the vertex.
FINDINGS IN THE PSYCHIATRIC GROUP
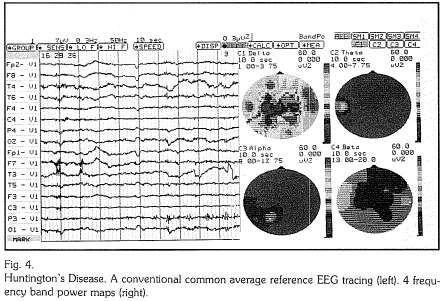
Case 1 Huntington's Disease (Fig. 4)
The conventional tracings on the left show a loss of alpha activity, a generalised slowing of frequencies and lowering of amplitudes. Periodic EMG artefacts are present. The increase in slow waves in the delta range and the loss of alpha rhythm is clearly seen in the brain maps. The EMG artefacts are represented in the beta band brain maps. The obvious EMG artefact at the left frontotemporal area is represented in the brain map as a green focus.
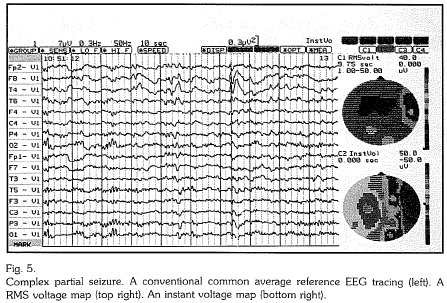
Case 2 Complex partial seizure (Fig. 5 & 6)
In Fig. 6, the conventional EEG tracings recorded spike-andwave patterns most prominent over the right fronto-temporal area. The focal location of the high voltage spikes are clearly shown in the RMS and instant voltage maps. In Fig. 7, the band power maps on the left show an increase in the delta and theta range over the right fronto-temporal area corresponding to the high voltage slow waves seen in the conventional tracing. On the right, the mapping of the mean RMS values of the normal sample is shown.
A z-score of the RMS values shown in Fig. 7 was computed with respect to these mean values and was mapped. Z-score, which is a measure of the deviation of a single reading from the mean value of a group, is highest in its value over the right fronto-temporal area. This indicates the seizure focus clearly.
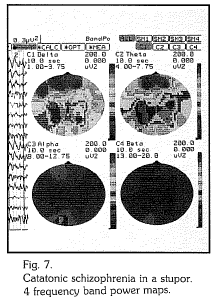
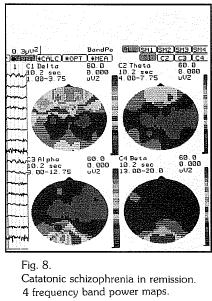
Case 3 Catatonic schizophrenia (Fig. 7 & 8)
The findings in Fig. 7 was recorded when the patient was in a catatonic stupor. The conventional tracing is marked by the presence of generalised slow waves and loss of posterior alpha activity. The predominance of slow waves is shown clearly on the band power brain maps. In Fig. 8, the results were recorded when the same patient was out of stupor after treatment with ECT and was free of catatonic symptoms. The conventional tracings show an essentially normal recording apart from the eye movement artefacts at the prefrontal leads. The maps show the disappearance of the slow waves recorded two weeks earlier. The topographic distribution of alpha activity returned to normal (refer to normal maps Fig. 2). The remaining anterior foci at the delta band are eye movement artefacts.
Case 4 Paranoid schizophrenia (Fig. 9)
The EEG tracings of the patient were essentially normal and are not shown. The conventional tracings of P300AEP are shown in Fig. 9. NlOO is clearly seen at around 100 msec. While P200 and P300 is delayed and attentuated and seen at around 213.3 sec. and 363.7msec. respectively. The P300 is mapped on the top left and when compared with the mean of the P300 from our sample (top right) (computed from the artefact-free data of seven normal subjects; Peak at 321msec., focus around the vertex and posterior central area), its delay in appearance, its attentuation and loss of localization is obvious. One of the maps shown (bottom right) displayed the standard deviation (SD) of P300 measures in the normal sample. Refering to the colour scale, it is clear how the SD values with respect to voltage distribute over the scalp. The SD value with respect to the time of occurence of P300 was 20.44msec. A z-score of the P300 of the patient was computed with respect to the normal sample mean and mapped (bottom left). It is shown clearly that all the z-score values are negative. This z-score map, when read together with the other maps in Fig. 9, clearly demonstrate the delay and attenuation of P300AEP in the patient.
DISCUSSION
From these preliminary findings both the EEG and EP recordings show a great consistency among the normal as reflected by the low value of the standard deviations.
EEG changes associated with organic brain diseases can be shown up clearly in brain maps and have the advantage over conventional tracing of being clearer to see and simpler to recognize. The abnormal maps when shown together with normal maps to patients and relatives greatly facilitate the explanation of the presence of disease and definitely improve compliance with treatment.
It is still interesting to see the presence of slow waves in catatonia and the normalization of EEG on recovery. This abnormality was not present in our paranoid schizophrenic. This gives some support to the idea of clinical subtypes in schizophrenia and the potential use of brain mapping in the further classification of schizophrenia. The gross changes in the EEG in catatonia may also suggest that catatonia is a neuropsychiatric disorder.
The brain map of the EEG of paranoid schizophrenic did not show any significant deviation from recordings of the normal. The P300 does however show an abnormal delay in latency and attenuation in amplitude.
CONCLUSION
These very preliminary findings show that topographic brain mapping of EEG and EP in Chinese subjects can differentiate between normals and patients with neuropsychiatric and other psychiatric disorders. Some of the changes were associated with the mental state and are reversible while the others are not. The applicability of brain mapping in the subtyping of psychiatric disorders requires further studies. This is only a preliminary single case study but its results are encouraging.
ACKNOWLEDGEMENT
We would like to thank Dr. Peter B.C. Fenwick in helping in the preparation of .the manuscript. We would also like to show our appreciation to Mr. Simon Au, Mr. Matthew Fan, Mr. Leung Chung Bo, Ms. Brenda Wong and Mr. Tommy Wong, members of the brain mapping team, for their ethusiastic and excellent supports during and between each recording session.
REFERENCES
Blackwood, D.H.R., Muir, W.J. (1990). Cognitive Brain Potentials and their Application. British Journal of Psychiatry, 157 (Suppl. 9), 96-101.
Duffy, F.H. (1989). Topographic Mapping of Brain Electrical Activity-Clinical Application and Issues. In Maurer, K. (Ed.) Topographic Brain Mapping of EEG and Evoked Potentials, 19-52. Springier-Verlag Berlin Heidelberg.
Hughes, J.R., Wilson, (Ed.) (1983). EEG and Evoked Potentials in Psychiatry and Behavioural Neurology. Butterworths. ltil, T.M. (1990). Computer-analyzed EEG Brain mapping-Facts and Myths. Abstracts of Second International Symposium on Imaging of the Brain in Psychiatry and Related Fields. Wurz. burg, West Germany.
John, E.R., Karmel, B.Z., Coming, W.C. et al (1977). Neurometrics. Science 196. 1393-1410.
Maurer, K. (1989). Mapping of Evoked Potentials in Normals and Patients with Psychiatric Diseases. In Maurer, K. (Ed.) Topographic Brain Mapping of EEG and Evoked Potentials, 458- 474, Springer-Verlag Berlin Heidelberg.
Shagass, C. (1983). Evoked Potentials in Adult Psychiatry. In Hughes, J.R., Wilson, W.R. (Ed.) Op. cit., 169-210.
*M.T.H. Wong MBBS, MRCPsych. Lecturer, Department of Psychiatry, University of Hong Kong.
Lieh-Mak MD, FRCPsych, FRANZCP, FAPA, JP. Professor and Head, Department of Psychiatry, University of Hong
Correspondence: Department of Psychiatry, University of Hong Kong, Queen Mary Hospital, Pokfulam, Hong