Hong Kong Journal of Psychiatry 2000;10(1):19-27
ORIGINAL ARTICLE
SE Chua, IWS Lam, KS Tai, WN Tang, EYH Chen, PWH Lee, FL Chan, F Lieh-Mak
ABSTRACT
Objectives: To describe the methodology for volumetric analyses of brain volumes in vivo by structural magnetic resonance imaging. To assess the reliability and validity of the volu- metric technique.
Methods: Patients were recruited for magnetic resonance imaging as part of a wider project studying biological determinants of psychosis. Volumetric analysis of brain scans was performed blind using a rapid automated in-house software package to remove non-brain elements (scalp-editing), and to calculate volumes of the whole brain, lateral ventricles, cerebrospinal fluid, and cortical gray and white matter compartments.
Results: Quantitative analyses of each magnetic resonance imaging scan took approxi- mately 45 minutes for each patient (between-group results will be reported later). Test- retest reliability for 20% of scans selected at random was generally high. Spearman’s rank correlation coefficient (rho) for whole brain was 0.99, grey matter was 0.79, white matter was 0.86, cerebrospinal fluid and sulcal compartment was 0.83 and lateral ven- tricle was 0.86. Inter-rater reliability by two independent assessors for the same sample of scans was high at 0.99 for whole brain and moderate for the other measures (grey matter and white matter was 0.62, cerebrospinal fluid and sulcal compartment was 0.60, lateral ventricle was 0.67). Face validity of the three-dimensional brain was good. An indepen- dent phantom analysis (measuring the volume of an object of known volume and intensity compartments) suggested that the estimated volumetric techniques were accurate to 97% and 98%, respectively.
Conclusion: This method is reliable, valid, and fast for the purpose of quantification of cerebral morphology on magnetic resonance imaging scans. We propose that it can be employed for the assessment and monitoring of neuropsychiatric disorders in which cerebral volumetric change occurs.
Keywords: Brain; Cerebral; Magnetic Resonance Imaging; Volume; Volumetric.
INTRODUCTION
Quantitative analysis of magnetic resonance imaging (MRI) brain images in vivo has became increasingly objective, fast and user-friendly. Traditional methods of volumetric analysis have depended upon manual tracing of regions of interest, but this is impractical for large data sets such as thin-slice contiguous images of the entire brain. These techniques are labour intensive, subject to individual bias, and based upon a priori hypothesis of regions of interest. In compari- son, automated techniques are able to measure the whole data set in a fraction of the time previously required, utilise objective measurement algorithms, and, more importantly for complex disorders such as schizophrenia, there is no need to select regions of interest so that potentially useful data need not be discarded.
In recent years, there has been a wealth of studies which support the existence of cerebral morphological abnormali- ties in schizophrenia.1,2 Of these the best-replicated find- ing is lateral ventricular enlargement; other changes which are somewhat more contentious include sulcal widening and cortical grey matter reduction.3 One explanation con- tributing to the inconsistency in the literature is that different groups have employed different volumetric techniques. In this paper, we describe in detail the methodology for brain volumetric analysis, and endeavour to assess whether it is a reliable and valid method. The volumetric analysis method (General Electric Advantage Windows Version 2.0) described is utilised for clinical diagnostic purposes, thus it is necessary to ascertain its reliability and validity as a research tool.
AIM
We aimed to demonstrate the use of in-house software to conduct volumetric analyses of the following brain volume parameters: whole brain volume, cerebrospinal fluid (CSF), lateral ventricles, and cortical grey and white matter.
METHODS
PATIENTS
The study enrolled patients admitted to the Queen Mary Hospital or Pamela Youde Nethersole Eastern Hospital, who were participating in a wider project to study the biological determinants of psychosis in a consecutive sample of patients with a first episode of psychosis (the results of which will be reported separately). Healthy controls were also recruited mainly from the hospital staff via hospital advertisements. All patients were screened for standard contraindications to MRI (cardiac pacemaker, MRI incompatible implants, preg- nancy) and were able to provide written informed consent. All scans were screened for the presence of abnormalities by an experienced radiologist. Three scans were excluded from the final analysis owing to movement artifact (two scans) and cavum septum pellucidum (one scan). The final sample for MRI volumetric analysis comprised 47 subjects (19 patients and 28 healthy controls).
MAGNETIC RESONANCE IMAGING ACQUISITION SEQUENCE
Magnetic resonance images of the brains were obtained with a 1.5-T superconducting magnet (Signa Horizon Echospeed; General Electric, Milwaukee, WI, USA) and a transmit-receive head coil. Total scanning time for each case was 20 minutes. The imaging protocol involved two sequences:
- A three-dimensional volume acquisition spoiled gradient-echo (SPGR) T1-weighted scan was performed in the sagittal plane with imaging parameter TR 30/TE 4/Flip angle 45o/FOV 24 x 24/Matrix 256 x 256, 128 con- tiguous 1.2 mm thick slices (voxel size = 0.9 mm x 1.2 mm = 1 mm3). The T1-weighted images gave good spatial resolution and grey-white matter delineation.
- A fast spin echo proton density (PD)/T2-weighted scan in the axial plane with imaging parameters of TR 3000-5000, TE 17/102, FOV 23 x 17, Matrix 256 x 256, Ne x 1, contiguous 3 mm slices (voxel size = 0.9 mm x 0.8 mm x 3 mm = 2mm3). PD/T2-weighted images allowed subtle pathology to be detected as foci of signal hyperintensity, and T2-weighted images permited clear visualisation of the interface between CSF and grey matter.
VOLUMETRIC ANALYSIS OF THE BRAIN
T1- and T2-weighted images were stored on magneto- optical disc and reformatted into coronal and axial planar slices to give three-dimensional images using an independent SUN work-station and image analysis software (General Electric Advantage Windows Version 2.0). This per mits volumetric analysis using any one of three basic modalities, of which the first two can be automated:
- Dynamic thresholding — involves choosing a lower and upper limit of pixel intensity or threshold on the brain image, and the pixels within the intensity range selected will be automatically counted and displayed by a frequency distribution histogram, along with the volume of the brain region selected.
- Erosion/dilatation — involves automatically separating two objects joined together and determining the volume of one or other object from the histogram.
- Paint-brush — involves manually tracing the region of interest, the area of which appears on the histogram, and the sum of the areas traced from slice to slice comprises the volume of the brain regions selected.
Quantitative analysis of the T1- and T2-weighted MRIs of each subject was performed blind to the identity and diagnostic group of the subject. The first two modalities described above were used to perform automated volumetric analysis of the whole brain, CSF, cortical grey and white matter compartments, and lateral ventricles. The paint- brush method was not used, since the tracing cursor had a tendency to shake causing image distortion of the selected region of interest.
To assess reliability of the volumetric method, measure- ments of 10% of the scans selected at random were performed by a single assessor who was blind to subject identity and diagnostic group, and re-measured after an interval of two months. A second assessor independently measured these same scans. To assess the convergent validity of this method, a phantom analysis was performed in which the volume of a phantom (i.e. an object with known reference volumetric pro- portions) was measured using the same approaches that were used for measuring the various brain parameters. Face valid- ity was assessed by comparing the whole brain, and its con- stituent regions with a standard anatomical reference atlas.
Whole Brain Volume
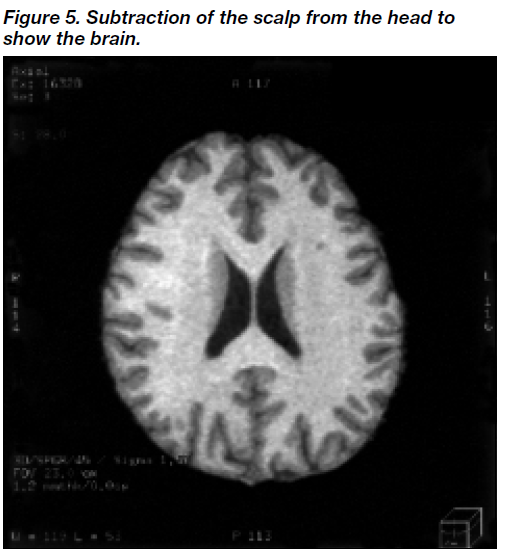
Susceptibility artifact occurs at the head-air inter face, as a rim of low-intensity pixels encircling the head. All such low-intensity pixels (pixels of intensity [10]) were removed first by applying a filter function to remove such extrane- ous sur face artifacts on the three-dimensional model of the head. Figures 1-6 show the steps in image processing using erosion and dilation to yield the whole brain volume. A three-dimensional model of the brain was then con- structed by refor matting the T1-weighted sagittal images in the coronal and axial planes (Figure 1). Thus, selected regions of interest could be viewed in three-dimensional planes. Next, the scalp was eroded by a number of layers (n), so that it became clearly separated from the brain (Figure 2). The eroded scalp was then removed from the screen by means of the select-object function. Subsequently, the brain was dilated back, through n layers, to its original volume (Figure 3). The dilated brain was then subtracted from the whole head, giving the scalp (Figure 4), and the scalp was then subtracted from the head to yield the whole brain (Figure 5). We chose to use the latter brain image for volumetric analysis because it had not under- gone any potential transformation by the processes of erosion and dilatation (Figure 5). Finally, the spinal cord situated caudal to the level of the base of the cerebellum was removed, using the ‘apply cut’ function. The final volume of the whole brain was then displayed on a histogram which plots the frequency distribution of the pixels in the brain image, from which the brain volume is automatically calculated and displayed (Figure 6).


Segmentation of Cerebrospinal Fluid from Cortical Grey Matter
Cerebrospinal fluid was segmented from the cortical grey matter using the dynamic thresholding modality. This tech- nique involved the following:
- a standard grey-scale brain image on which the observer can select pixels to be highlighted in colour
- an identical grey-scale brain image at the same plane for reference
- a histogram on which the frequency distribution of all pixels in the grey-scale brain image is displayed.
First, the smoothing function was employed which helps to clarify the location of peaks and troughs on the histogram. Segmentation of CSF from the cortical grey matter is shown in Figures 7 and 8. Figure 7a shows the histogram with multi- phasic distribution of CSF, grey matter, and white matter. Then, using a visual-interactive method, the observer can select or threshold out any region of interest within a given range of pixels. This is a dynamic process in which the minimum and maximum pixel intensity thresholds are manually adjusted on the histogram in order to correspond to a given region of interest (CSF; Figure 7a) such that the CSF appears in the brain image as coloured pixels in the CSF space (Figure 7b). The trough situated in between the CSF peak and the grey matter peak can be regarded as the CSF-grey matter interface. Taking the trough as the cut off point, the coloured ‘thresholded’ CSF region is usually checked against the CSF in the grey-scale brain image. Where the coloured CSF pixels correspond in spatial extent to the CSF in the original grey- scale reference image, the threshold is taken as the interface between the CSF and the cortical grey matter (Figure 8a). We checked all three orthogonal planes of view to derive the maxi- mum threshold for CSF, i.e. the CSF-grey matter interface. The minimum pixel intensity threshold (10) had been pre-set at the stage of reformatting the brain into a three-dimensional image. Thus the visual interactive method compares dynamic threshold images (coloured images that are displayed on the screen with variable pixel thresholds) with the grey-scale image. Adjustment of the pixel threshold to a point where slices in all three planes displayed the same grey-CSF bound- ary (i.e. maximum threshold for the range of pixel intensities for CSF) gave the grey-CSF threshold for the scan. Finally the segmented CSF image was constructed by applying this thres- hold to the grey-scale image, such that the CSF was defined, and its volume displayed on the histogram (Figure 8b).


Segmentation of Cortical Grey Matter from White Matter
Segmentation of cortical grey matter from white matter is shown in Figures 9 and 10. The cortical grey matter image was constructed using a similar approach to obtain the grey- white threshold and histogram (Figure 9). The intersection be- tween grey and white matter was taken as the point of refer- ence from which an estimate was derived. Again this was done according to dynamic visualisation of the grey and white matter interface on the grey-scale reference image. This thres- hold was then applied to the grey-scale image resulting in an image of the cortical grey matter compartment (Figure10).


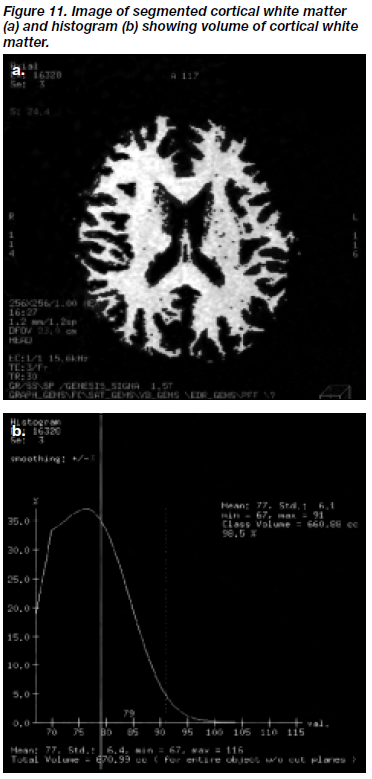
Segmentation of Cortical White Matter
Segmentation of the cortical white matter was achieved by applying the grey-white matter threshold to the remaining brain image. Figure 11 shows the segmented cortical white matter compartment and its corresponding histogram.
LATERAL VENTRICLES
The dynamic thresholding modality was again used in order to define the lateral ventricles. On this occasion, T2-weighted brain images were employed since these showed clearer contrast of the CSF-grey matter boundary, and thus permit- ted the ventricular system to be easily identified.
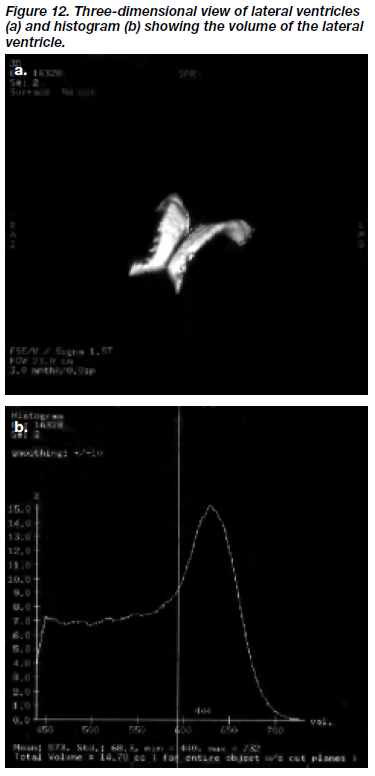
Firstly, all axial slices where the lateral ventricles ap- peared were selected for volume analysis, the lowest slice being the one just below the slice showing the beginning of the third ventricle. Initially, the axial images were thres- holded at a value of 100 in order to minimise artifact as well as facilitate refor mulating into the three-dimensional image. The contrast function was used to accentuate contrast between CSF and grey matter. The smoothing function in the histogram was also adjusted so as to clarify the point of rarity between the CSF and grey matter pixels. Dynamic thresholding was again used, which involved the selection of a maximum threshold of pixel intensity, repre- senting the CSF-grey interface, so that the lateral ventricles were filled with coloured pixels. This threshold was then applied to the reference grey-scale image in order to high- light and segment out those regions containing CSF. The lateral ventricles were then selected for analysis and a scalpel function employed manually to remove all non- ventricular material extraneous to the lateral ventricles. The resulting three-dimensional image of the lateral ventricles was examined (Figure 12a), and its volume was displayed on a histogram (Figure 12b).
STATISTICAL ANALYSIS
Spearman’s correlation coefficient was calculated to assess the test-retest and inter-rater reliability of the volumetric methods. We also assessed the validity of this method, based on the face validity of the processed brain, and con- structed a phantom analysis to assess for convergent validity of the method. All statistical analyses were conducted with SPSS Version 8.0 for Windows.
RESULTS
RELIABILITY
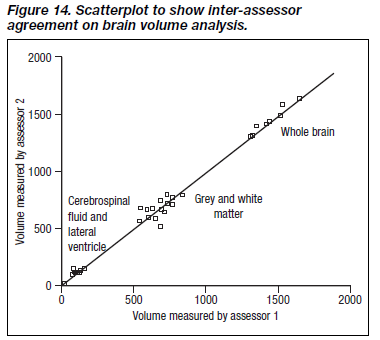
Since distribution of volumes was non-parametric, a conser- vative approach was adopted and Spearman’s correlation coefficients employed to examine the correlation between measures. Reliability indices are shown in Table 1, and dis- played graphically in Figures 13 and 14.
Test-retest reliability was generally high, and ranged from 0.79 for cortical grey matter to 0.99 for whole brain. The level of inter-rater reliability was also good for the whole brain, but moderate for other measures (Table 1).


VALIDITY
Face Validity
Face validity for the modality of erosion and dilatation was satisfactory judging from the quality of the reconstructed three-dimensional images of the brain. The final three- dimensional brain image (Figure 15) is free of any potential artifact arising from this kind of image processing since the final brain image has not been subjected to erosion or dila- tion processes. The outer appearance of the reconstructed brain clearly shows gyral and sulcal folds, and the cortical and subcortical morphology accorded satisfactorily with reference images in a standard neuroanatomical atlas (Figure 15).

Phantom Analysis (Convergent Validity)
The phantom consisted of a piece of rectangular glass inside a plastic box filled with 500 ml distilled water. Magnetic resonance images of this phantom were obtained using the same MRI acquisition sequence. The composite volumes of the phantom were determined, blind to knowledge of the reference volume, using the same image segmentation techniques that were used to measure the brain. Using the dynamic thresholding approach, the volume estimate was 515 ml (margin of error 3%), whilst by erosion/dilation the volume was 491 ml (margin of error 1.8%).
DISCUSSION AND CONCLUSION
VALIDITY OF THE VOLUMETRIC ANALYSIS
In this study, test-retest reliability was highest for the whole brain (Spearman’s rho was 0.99), and also high for cortical grey matter at 0.79, cortical white matter and lateral ven- tricle were 0.86, and CSF and sulcal compartment were 0.83. Inter-rater reliability was also high for the whole brain (0.99), and moderate for grey and white matter (0.62 m), CSF and sulcal compartment (0.60), and lateral ventricle (0.67). Taken together, the test-retest correlation and inter- rater correlation were significant and not unexpected, given that the volumetric techniques were largely automated. Also, segmentation of the brain regions was performed by reference to a histographic display of pixel intensity thresh- olds, thus improving the objectivity of the volumetric method.
On the basis of this phantom experiment, the estimated volumes corresponded closely to the actual volume of the phantom, with a 3% margin of error or less. However, an obvious criticism of the phantom object used was that it was very different in characteristics from a complex biological organ in that it was very simple and geometric in its dimen- sions, constructed of artificial rather than biological material, with a non-continuous frequency distribution of pixels.
Another disadvantage of this technique is its inability to differentiate between ventricular and sulcal CSF and extra-cerebral fluid. Separation of sulcal and ventricular CSF could not be achieved using the thresholding procedure due to the fact that sulcal and ventricular CSF, and extra- cerebral fluid have similar pixel intensity distribution. More- over, the sulcal volume is also difficult to delineate precisely, so that the values for sulcal volume which we present are only a rough approximation obtained by subtracting the volume of the lateral ventricles from the volume of the total CSF. An alternative technique, apart from identifying cutoff points from a histogram of signal intensities would be needed for more accurate sulcal volume estimation.
The volumetric procedure was reasonably fast, in that a single subject brain could be processed in about 45 minutes. This is attributable to the automated nature of the programme, which does not require tracing of regions of interest manu- ally, and is also capable of instantly calculating the volume of a brain region in three-dimensional space. Thus, this method is suitable for analysing large data sets generated by current thin-slice MRI technology.
Notwithstanding its limitations, this volumetric method is capable of measuring cerebral volumes with proven reliabil- ity, speed, and validity. Currently, this volumetric method is being applied to the quantitative brain analysis in patients having their first episode of schizophrenia. We suggest that this tool can be applied for the assessment and monitoring of other neuropsychiatric disorders where brain aplasia or atrophy may be present.
REFERENCES
- Robert GW. Schizophrenia: a neuropathological perspective. Br J Psychiatry 1991;158:8-17.
- Bogerts B. Recent advances in the neuropathology of schizophre- nia. Schizophr Bull 1993;19:431-445.
- Chua SE, McKenna PJ. Schizophrenia — a brain disease? A critical review of structural and functional cerebral abnormality in the disorder. Br J Psychiatry 1995;166:563-582.
Acknowledgement and ethical approval: This project was supported by a grant from the Committee for Conference and Research Grants, The University of Hong Kong. Ethical approval was granted by the Ethics Committees of the Faculty of Medicine, The University of Hong Kong and the Pamela Youde Nethersole Eastern Hospital. We thank Dr Jennifer Chan of the Statistics Department, The University of Hong Kong, for statistical advice.
Dr SE Chua, MA, BM, BCh, MRCPsych, Assistant Professor, Department of Psychiatry, The University of Hong Kong, Pokfulam Road, Hong Kong, China.
Miss IWS Lam, BSc, Research Assistant, Department of Psychiatry, The University of Hong Kong, Pokfulam Road, Hong Kong, China.
Dr KS Tai, MB, BS, DMRD, FRCR, FHKAM(Radiology), FHKCR, Consultant Radiologist, Department of Diagnostic Radiology, Queen Mary Hospital, Pokfulam Road, Hong Kong, China.
Dr WN Tang, MB, BS, MRCPsych, FHKAM(Psych), Chief of Service and Consultant Psychiatrist, Department of Psychiatry, Pamela Youde Nethersole Eastern Hospital, Chai Wan, Hong Kong, China.
Dr EYH Chen, MA, MBChB, FHKAM(Psych), Associate Professor, Department of Psychiatry, The University of Hong Kong, Pokfulam Road, Hong Kong, China.
Dr PWH Lee, BSocSc, MSocSc(Clin Psy), Ph D, Clinical Psychologist, Department of Psychiatry, The University of Hong Kong, Pokfulam Road, Hong Kong, China.
Dr FL Chan, MB, BS, DMRD, FRCR, FHKAM(Radiology), Chief of Service and Consultant Radiologist, Department of Diagnostic Radiology, Queen Mary Hospital, Pokfulam Road, Hong Kong, China.
Prof. F Lieh-Mak, CBE, MD, FRCPsych, FRANZCP, FHKAM(Psych), FAPA, JP, Head & Chair, Department of Psychiatry, The University of Hong Kong, Pokfulam Road, Hong Kong, China.
Address for correspondence: Dr SE Chua
Department of Psychiatry Queen Mary Hospital Pokfulam Road
Hong Kong, China.